Reports
Clicks, the visitors who arrived and the inquiries they sent, across your campaigns.
Clicks
2,500
of 2,500 target
Visitors who arrived
2,029
81% of clicks · counted by our tracking on the page
Inquiries
42
2.1% of visitors sent an inquiry
Device split
2,500 clicks- Mobile and tablet1,63165%
- Desktop86935%
0.38% of 649,997 ad views were clicked.
Daily performance
Average a day
119
Where your inquiries came from
by the audience that found themEvery inquiry is traced back through the visit and the click to the audience that found the traveler first. The rate is inquiries per visitor who arrived; the account average is 2.1%.
Opening emails from brands like yours
People who open newsletters from your competitors
- Visitors
- 919
- Inquiries
- 17
- Rate
- 1.9%
Back for a second look
People who have already been to your site
- Visitors
- 555
- Inquiries
- 14
- Rate
- 2.5%
Like your best customers
Modeled on the travelers who already inquired or booked
- Visitors
- 555
- Inquiries
- 11
- Rate
- 2.0%
| Audience | Visitors | Inquiries | Rate |
|---|---|---|---|
Opening emails from brands like yours People who open newsletters from your competitors | 919 | 17 | 1.9% |
Back for a second look People who have already been to your site | 555 | 14 | 2.5% |
Like your best customers Modeled on the travelers who already inquired or booked | 555 | 11 | 2.0% |
A traveler matched by two audiences is credited to both in proportion; the totals add back to the 42 inquiries above. We never see names or email addresses.
Your pictures, best first
by click-throughClick-through is clicks per impression: what the picture and headline earn on the page. The account average is 0.38%. The inquiry rate beside it says whether the people a picture brought were the right ones.
 Best click-through
Northern lights in Norway: 2027 dates now open
Norway
- Click-through
- 0.38%
- Clicks
- 2,500
- Inquiries
- 42 · 2.1%
Where they came from
2,500 clicksBy state, from the traveler’s own location. Hover a state or a row.
Top states
Campaign report and target summary
2,500 clicks| Campaign | Status | Target | Delivered | Views | Desktop | Mobile | Arrived | Inquiries |
|---|---|---|---|---|---|---|---|---|
| Norway · 1 campaign | ||||||||
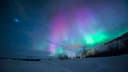 Northern lights in Norway: 2027 dates now open KJ-1048 · Live September 1 · 18 days | Completed | 2,500 | 2,500 | 649,997 | 869 | 1,631 | 2,029 | 42 |
| Total | 2,500 | 2,500 | 649,997 | 869 | 1,631 | 2,029 | 42 | |
Northern lights in Norway: 2027 dates now open
Completed- Delivered
- 2,500 / 2,500
- Arrived
- 2,029
- Inquiries
- 42
About these numbers
ClicksWhat the ad network counts, and what self-serve credit is drawn against. Refreshed through the day; the network’s own figures can run up to two and a half hours behind, so today fills in by the evening.
Visitors who arrivedClicks that became a page load our tracking saw. The gap is people who tap and leave before the page opens. You can check every visit in your own analytics.
InquiriesCounted on the page where the traveler takes the step — your form, or one we build. We report what happened; we never promise a number of inquiries.